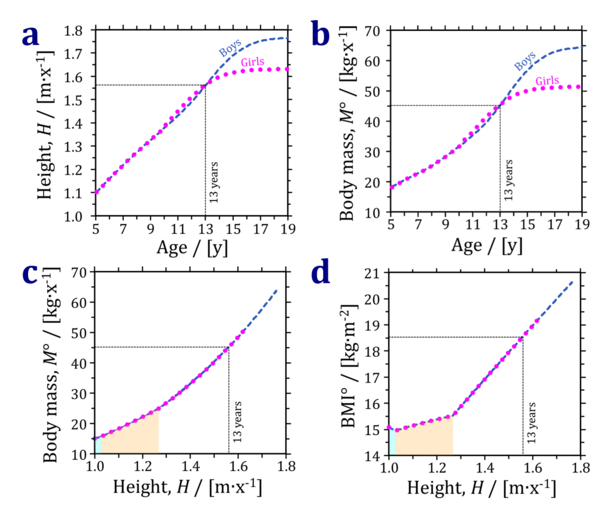
De Onis 2007 Bull World Health Organization
| de Onis M, Onyango AW, Borghi E, Siyam A, Nishida C, Siekmann J (2007) Development of a WHO growth reference for school-aged children and adolescents. Bull World Health Organization 85:660-7. |
de Onis M, Onyango AW, Borghi E, Siyam A, Nishida C, Siekmann J (2007) Bull World Health Organization
Abstract: OBJECTIVE: To construct growth curves for school-aged children and adolescents that accord with the WHO Child Growth Standards for preschool children and the body mass index (BMI) cut-offs for adults.
METHODS: Data from the 1977 National Center for Health Statistics (NCHS)/WHO growth reference (1-24 years) were merged with data from the under-fives growth standards' cross-sectional sample (18-71 months) to smooth the transition between the two samples. State-of-the-art statistical methods used to construct the WHO Child Growth Standards (0-5 years), i.e. the Box-Cox power exponential (BCPE) method with appropriate diagnostic tools for the selection of best models, were applied to this combined sample.
FINDINGS: The merged data sets resulted in a smooth transition at 5 years for height-for-age, weight-for-age and BMI-for-age. For BMI-for-age across all centiles the magnitude of the difference between the two curves at age 5 years is mostly 0.0 kg/m(2) to 0.1 kg/m(2). At 19 years, the new BMI values at +1 standard deviation (SD) are 25.4 kg/m(2) for boys and 25.0 kg/m(2) for girls. These values are equivalent to the overweight cut-off for adults (> or = 25.0 kg/m(2)). Similarly, the +2 SD value (29.7 kg/m(2) for both sexes) compares closely with the cut-off for obesity (> or = 30.0 kg/m(2)).
CONCLUSION: The new curves are closely aligned with the WHO Child Growth Standards at 5 years, and the recommended adult cut-offs for overweight and obesity at 19 years. They fill the gap in growth curves and provide an appropriate reference for the 5 to 19 years age group.
• Bioblast editor: Gnaiger E
Labels: MiParea: Gender, Developmental biology
Pathology: Obesity
Organism: Human
Preparation: Intact organism
BMI, BME
From BMI to BME

