Body mass excess: Difference between revisions
From Bioblast
No edit summary |
No edit summary |
||
| Line 70: | Line 70: | ||
::::# https://ourworldindata.org/obesity | ::::# https://ourworldindata.org/obesity | ||
::::# https://ourworldindata.org/human-height | ::::# https://ourworldindata.org/human-height | ||
== Publication list BME == | |||
'''''Sort in ascending/descending order by a click on one of the small symbols in squares below'''''. | |||
Default sorting: chronological. Empty fields appear first in ascending order. | |||
{{#ask:[[Category:Publications]] [[Additional label::BME]] | |||
|?Was published in year=Year | |||
|?Has title=Reference | |||
|?Mammal and model=Organism | |||
|?Tissue and cell=Tissue;cell | |||
|?Stress | |||
|?Diseases | |||
|format=broadtable | |||
|limit=5000 | |||
|offset=0 | |||
|sort=Was published in year | |||
|order=descending | |||
}} | |||
Revision as of 13:36, 8 December 2019

- high-resolution terminology - matching measurements at high-resolution
Body mass excess
Description
The body-mass excess with respect to the healthy reference population, HRP, is defined as BME ≝ m/m°, where m is your actual body-mass and m° is the body-mass at your height in the HRP. A balanced BME is BME°=1.0 with a band width of -0.1 towards underweight and +0.2 towards overweight. Considering a height of 1.78 m, the balanced body-mass is 65.9 kg, and overweight (body-mass index, BMI>24.9) is reached at a weight gain of 20 % (BME=1.2 at 79 kg). At a height of 1.84 m, the balanced body-mass is 72.4 kg, and obesity (BMI>29.9) is reached at a weight gain of 40 % (BME=1.4 at 101.4 kg).
Abbreviation: BME
Reference: Gnaiger 2019 MiP2019
BME - the body-mass excess calculator
» BME calculator
Erich Gnaiger and Paolo Cocco: work in progress - last update 2019-11-27
- The BME calculator is based on the WHO database on children up to 10 years of age (WHO Multicentre Growth Reference Study Group, WHO MGRS 2006), and on the Committee on Biological Handbooks data set (CBH; Zimmer 1962) on adoselscents to aduls, according to the tables listed below. The results have to be critically evaluated. The BME calculator applies to healthy controls (except for obesity), without sarcopenia.
- Open the BME calculator by clicking here (press Ctrl and left mouse click): BME calculator
- Click into the field Height, h [m] and enter your height in meters (not cm), using the dot (not the comma) as a separator for decimal places. Example: 1.70
- Click into the field Body-mass, m [kg] and enter your mass (weight) in kilograms (not pounds), using the dot (not the comma) as a separator for decimal places. Example: 63.4
- Click into the field Click here for results. This activates the caclulator. Results are displayed in the fields below.
- The Body-mass excess, BME is calculated from your height and body-mass. Example: 1.1 (With a BME of 1.1 you are 10 % above the reference body-mass, which is well within the normal range.) The percentage is calculated as (BME-1)*100.
- For comparison with a commonly used index, the Body-mass index, BMI is calculated from your body-mass divided by your height squared. Example: 21.9 (What does this index tell you?)
- The Reference body-mass, m° is calculated from your height and shows the corresponding body-mass of a person from the healthy reference population. Example: 57.7 (You can compare this reference body-mass of 57.7 kg with your measured body-mass of 63.4 kg.)
- The expected maximum aerobic exercise capacity per body-mass, VO2max/m, at a BME of 1.1 is 55 mL·min-1·kg-1. The calculated VO2max/m applies to healthy adults, and does not apply to BME<1.
- The Overweight body-mass, m+ and Obese body-mass, m++ are calculated from the reference body-mass. You can compare these limiting values with your actual body-mass. Example: 69.2 (Equal or more than 69.2 kg is rated as overweight for a height of 1.70 m with BME=1.2.); 80.8 (Equal or more than 80.8 kg is rated as obese for a height of 1.70 m with BME=1.4.)
- If you want to edit your height or body-mass entered above, click into the corresponding field, delete the previously entered number, enter the new number, and click into the field Click here for results.
Body-mass excess (BME) compared to body-mass index (BMI)
- Balanced standard: BME = 1.0
- Overweight: BME ≥ 1.2
- Obese: BME ≥ 1.4
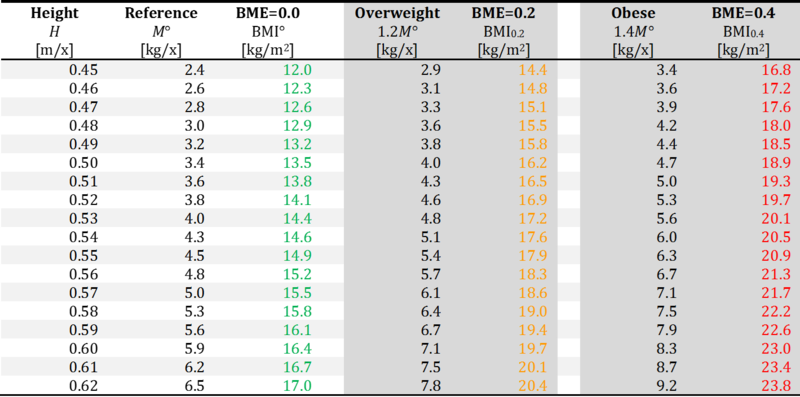
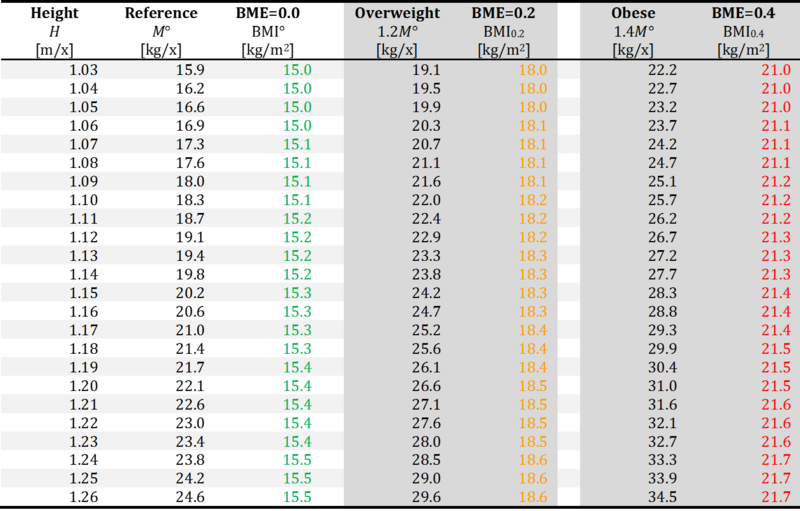
- For 0.45 to 1.26 m heights (newborns and children), the tables are based on data for WHO Child Growth Standards (WHO Multicentre Growth Reference Study Group, MGRS [8, 9]) compiled from Brazil, Ghana, India, Norway, Oman and the USA, reporting as little as 3 % differences between these groups, and less than 2 % differences between girls and boys.
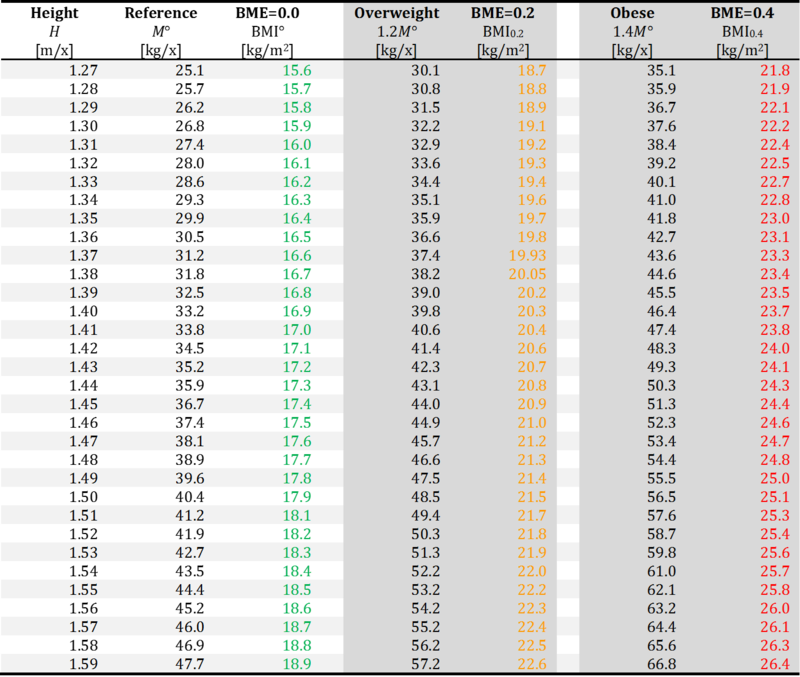
- For heights of 1.27 m and above, the tables are based on a Committee on Biological Handbooks data set (CBH [2]), compiled from publications between 1931 to 1944 [3-7]. These agree with WHO MGRS data at heights 1.27 to 1.4 m (children and adolescents) [9] within 1 %, and agree on noting no differences between females and males.
BME at height 0.45 - 0.62 m
- Based on WHO MGRS [9]: m° = 28.60·h3.086

BME at height 0.63 - 1.02 m
- Based on WHO MGRS [9]: m° = 15.08·h1.704
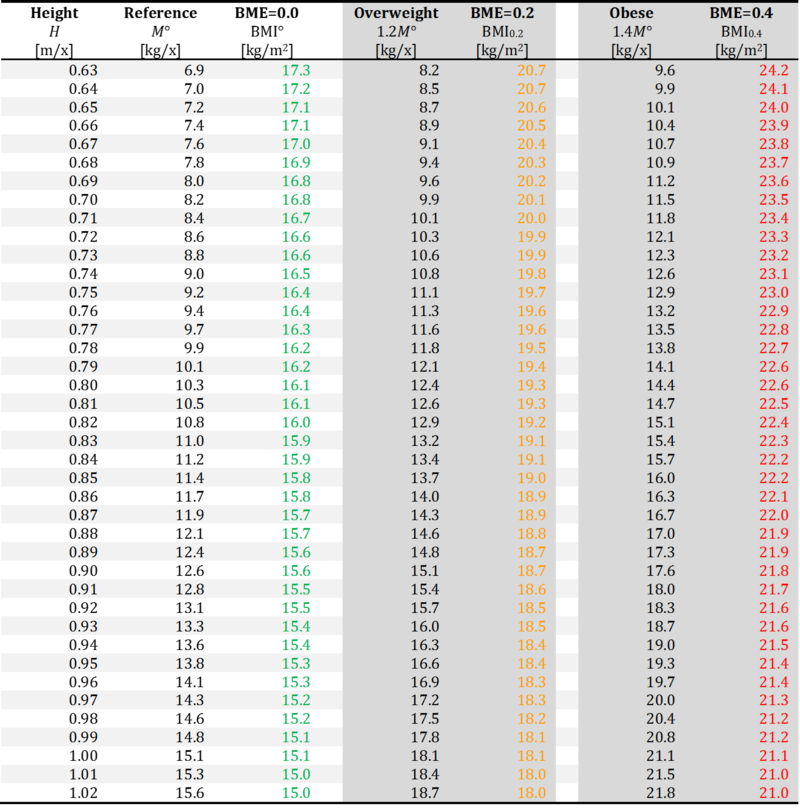

BME at height 1.03 - 1.26 m
- Based on WHO MGRS [9]: m° = 14.89·h2.178

BME at height 1.27 - 2.0 m
- Based on Biological Handbooks [9], extrapolated >1.8 m: m° = 12.68·h2.857


References
- Gnaiger E (2019) OXPHOS capacity in human muscle tissue and body-mass excess – the MitoEAGLE mission towards an integrative database. 14th Conference on Mitochondrial Physiology: Mitochondrial function: changes during life cycle and in noncommunicable diseases - COST MitoEAGLE perspectives and MitoEAGLE WG and MC Meeting. Belgrade RS, 13-16 Oct 2019. - »Bioblast link«
- Zucker TF (1962) Regression of standing and sitting weights on body weight: man. In: Altman PL, Dittmer DS, eds: Growth including reproduction and morphological development. Committee on Biological Handbooks, Fed Amer Soc Exp Biol:336-7. – Anthropometry, h and m°, of the healthy reference population, HRP; based on [3-7].
- Bayley N, Davis FC (1935) Growth changes in bodily size and proportions during the first three years. Biometrika 27:26-87.
- Gray H, Ayres JG (1931) Growth in private school children. Behavior Res Fund Monog, Univ Chicago Press, Chicago:282 pp. – With averages and variabilities based on 3110 measurings on boys and 1473 on girls from the ages of one to nineteen years.
- Meredith HV (1935) Univ Iowa studies in child welfare 11(3).
- Peatman JG, Higgons RA (1938) Growth norms from birth to the age of five years: a study of children reared with optimal pediatric and home care. Am J Diseases Children 55:1233-1247.
- Simmons KW (1944) Monographs Soc Research in Child Develop 9(1).
- WHO Multicentre Growth Reference Study Group (2006) WHO child growth standards based on length/height, weight and age. Acta Pædiatrica Suppl 450:76-85.
- WHO Multicentre Growth Reference Study Group (2006) WHO child growth standards: length/height-for-age, weight-for-age, weight-for-length, weight-for-height and body mass index-for-age: Methods and development. Geneva: World Health Organization:312 pp.
Links
Publication list BME
Sort in ascending/descending order by a click on one of the small symbols in squares below.
Default sorting: chronological. Empty fields appear first in ascending order.
| Year | Reference | Organism | Tissue;cell | Stress | Diseases | |
|---|---|---|---|---|---|---|
| National Academies of Sciences, Engineering, and Medicine 2024 Body composition and obesity | 2024 | National Academies of Sciences, Engineering, and Medicine (2024) Exploring the science on measures of body composition, body fat distribution, and obesity. National Academies Press, Washington, DC https://doi.org/10.17226/27461. | Human | Fat | Obesity | |
| National Academies of Sciences, Engineering, and Medicine 2023 BMI and beyond | 2023 | National Academies of Sciences, Engineering, and Medicine (2023) BMI and beyond: Considering context in measuring obesity and its applications: Proceedings of a workshop—in brief. The National Academies Press, Washington, DC. https://doi.org/10.17226/27185 | Human | Fat | Obesity | |
| Chambers 2020 J Appl Physiol (1985) | 2020 | Chambers TL, Burnett TR, Raue U, Lee GA, Finch WH, Graham BM, Trappe TA, Trappe S (2020) Skeletal muscle size, function, and adiposity with lifelong aerobic exercise. J Appl Physiol (1985) 128:368–78. | Human | Skeletal muscle Fat | Aging;senescence | |
| Misra 2019 J Postgrad Med | 2019 | Misra P, Singh AK, Archana S, Lohiya A, Kant S (2019) Relationship between body mass index and percentage of body fat, estimated by bio-electrical impedance among adult females in a rural community of North India: A cross-sectional study. J Postgrad Med 65:134-40. | Human | Fat | Obesity | |
| Hood 2019 Nutr Diabetes | 2019 | Hood K, Ashcraft J, Watts K, Hong S, Choi W, Heymsfield SB, Gautam RK, Thomas D (2019) Allometric scaling of weight to height and resulting body mass index thresholds in two Asian populations. Nutr Diabetes 9:2. doi: 10.1038/s41387-018-0068-3. | Human | Obesity | ||
| Mialich 2018 J Electr Bioimp | 2018 | Mialich MS, Silva BR, Jordao AA (2018) Cutoff points of BMI for classification of nutritional status using bioelectrical impedance analysis. J Electr Bioimp 9:24-30. | Human | Fat | Obesity | |
| NCD-RisC 2017 Lancet | 2017 | NCD Risk Factor Collaboration (NCD-RisC) (2017) Worldwide trends in body-mass index, underweight, overweight, and obesity from 1975 to 2016: a pooled analysis of 2416 population-based measurement studies in 128·9 million children, adolescents, and adults. Lancet 390:2627–42. | Human | Obesity | ||
| Wollner 2017 J Public Health Res | 2017 | Wollner M, Paulo Roberto BB, Alysson Roncally SC, Jurandir N, Edil LS (2017) Accuracy of the WHO's body mass index cut-off points to measure gender- and age-specific obesity in middle-aged adults living in the city of Rio de Janeiro, Brazil. J Public Health Res 6:904. | Human | Fat | Obesity | |
| Distefano 2016 J Gerontol A Biol Sci Med Sci | 2016 | Distefano G, Standley RA, Dubé JJ, Carnero EA, Ritov VB, Stefanovic-Racic M, Toledo FG, Piva SR, Goodpaster BH, Coen PM (2016) Chronological age does not influence ex-vivo mitochondrial respiration and quality control in skeletal muscle. J Gerontol A Biol Sci Med Sci 72:535-42. | Human | Skeletal muscle | Aging;senescence | |
| Korre 2016 Am J Cardiol | 2016 | Korre M, Porto LG, Farioli A, Yang J, Christiani DC, Christophi CA, Lombardi DA, Kovacs RJ, Mastouri R, Abbasi S, Steigner M, Moffatt S, Smith D, Kales SN (2016) Effect of body mass index on left ventricular mass in career male firefighters. Am J Cardiol 118:1769-1773. | Human | Heart | Cardiovascular Obesity | |
| Indian Academy of Pediatrics Growth Charts Committee 2015 Indian Pediatr | 2015 | Indian Academy of Pediatrics Growth Charts Committee, Khadilkar V, Yadav S, Agrawal KK, Tamboli S, Banerjee M, Cherian A, Goyal JP, Khadilkar A, Kumaravel V, Mohan V, Narayanappa D, Ray I, Yewale V (2015) Revised IAP growth charts for height, weight and body mass index for 5- to 18-year-old Indian children. Indian Pediatr 52:47-55. | Human | Aging;senescence Obesity | ||
| Gnaiger 2015 Scand J Med Sci Sports | 2015 | Gnaiger E, Boushel R, Søndergaard H, Munch-Andersen T, Damsgaard R, Hagen C, Díez-Sánchez C, Ara I, Wright-Paradis C, Schrauwen P, Hesselink M, Calbet JAL, Christiansen M, Helge JW, Saltin B (2015) Mitochondrial coupling and capacity of oxidative phosphorylation in skeletal muscle of Inuit and caucasians in the arctic winter. https://doi.org/10.1111/sms.12612 | Human | Skeletal muscle | Temperature | |
| Mialich 2014 Nutr Hosp | 2014 | Mialich MS, Martinez EZ, Jordao JJ (2014) Application of body mass index adjusted for fat mass (BMIfat) obtained by bioelectrical impedance in adults. Nutr Hosp 30:417-24. | Human | Fat | Obesity | |
| Andersen 2013 Int J Circumpolar Health | 2013 | Andersen S, Fleischer Rex K, Noahsen P, Sørensen HC, Mulvad G, Laurberg P (2013) Raised BMI cut-off for overweight in Greenland Inuit--a review. Int J Circumpolar Health 2013 Aug 5;72. doi: 10.3402/ijch.v72i0.21086. | Obesity | |||
| Loe 2013 PLOS ONE | 2013 | Loe H, Rognmo Ø, Saltin B, Wisløff U (2013) Aerobic capacity reference data in 3816 healthy men and women 20-90 years. PLOS ONE 8:e64319. | Human | |||
| Pesta 2011 Am J Physiol Regul Integr Comp Physiol | 2011 | Pesta D, Hoppel F, Macek C, Messner H, Faulhaber M, Kobel C, Parson W, Burtscher M, Schocke M, Gnaiger E (2011) Similar qualitative and quantitative changes of mitochondrial respiration following strength and endurance training in normoxia and hypoxia in sedentary humans. Am J Physiol Regul Integr Comp Physiol 301:R1078–87. | Human | Skeletal muscle | Hypoxia | Obesity |
| Pribis 2010 Nutrients | 2010 | Pribis P, Burtnack CA, McKenzie SO, Thayer J (2010) Trends in body fat, body mass index and physical fitness among male and female college students. Nutrients 2:1075-85. | Human | Obesity | ||
| Meeuwsen 2010 Clin Nutr | 2010 | Meeuwsen S, Horgan GW, Elia M (2010) The relationship between BMI and percent body fat, measured by bioelectrical impedance, in a large adult sample is curvilinear and influenced by age and sex. Clin Nutr 29:560-6. | Human | Fat | Aging;senescence Obesity | |
| Gnaiger 2009 Int J Biochem Cell Biol | 2009 | Gnaiger E (2009) Capacity of oxidative phosphorylation in human skeletal muscle. New perspectives of mitochondrial physiology. Int J Biochem Cell Biol 41:1837-45. https://doi.org/10.1016/j.biocel.2009.03.013 | Human Mouse | Skeletal muscle | Aging;senescence Obesity | |
| Bosy-Westphal 2009 Br J Nutr | 2009 | Bosy-Westphal A, Plachta-Danielzik S, Dörhöfer RP, Müller MJ (2009) Short stature and obesity: positive association in adults but inverse association in children and adolescents. Br J Nutr 102:453-61. | Fat | Obesity | ||
| Raboel 2009 Diabetes Obes Metab | 2009 | Raboel R, Hojberg PM, Almdal T, Boushel RC, Haugaard SB, Madsbad S, Dela F (2009) Improved glycaemic control decreases inner mitochondrial membrane leak in type 2 diabetes. Diabetes Obes Metab 11:355-60. | Human | Skeletal muscle | Mitochondrial disease | Diabetes |
| Romero-Corral 2008 Int J Obes (Lond) | 2008 | Romero-Corral A, Somers VK, Sierra-Johnson J, Thomas RJ, Collazo-Clavell ML, Korinek J, Allison TG, Batsis JA, Sert-Kuniyoshi FH, Lopez-Jimenez F (2008) Accuracy of body mass index in diagnosing obesity in the adult general population. Int J Obes (Lond) 32:959-66. | Human | Fat | Obesity | |
| Daussin 2008 Am J Physiol Regul Integr Comp Physiol | 2008 | Daussin FN, Zoll J, Dufour SP, Ponsot E, Lonsdorfer-Wolf E, Doutreleau S, Mettauer B, Piquard F, Geny B, Richard R (2008) Effect of interval versus continuous training on cardiorespiratory and mitochondrial functions: relationship to aerobic performance improvements in sedentary subjects. Am J Physiol Regul Integr Comp Physiol 295:R264-72. | Human | Skeletal muscle | ||
| Boushel 2007 Diabetologia | 2007 | Boushel RC, Gnaiger E, Schjerling P, Skovbro M, Kraunsoee R, Dela F (2007) Patients with Type 2 diabetes have normal mitochondrial function in skeletal muscle. Diabetologia 50:790-6. | Human | Skeletal muscle | Diabetes Obesity | |
| De Onis 2007 Bull World Health Organization | 2007 | de Onis M, Onyango AW, Borghi E, Siyam A, Nishida C, Siekmann J (2007) Development of a WHO growth reference for school-aged children and adolescents. Bull World Health Organization 85:660-7. | Human | Obesity | ||
| Bakkman 2007 ActaPhysiol | 2007 | Bakkman L, Sahlin K, Holmberg HC, Tonkonogi M (2007) Quantitative and qualitative adaptation of human skeletal muscle mitochondria to hypoxic compared with normoxic training at the same relative work rate. Acta Physiol (Oxford) 190:243–51. | Human | Skeletal muscle | Oxidative stress;RONS | |
| Mogensen 2006 J Physiol | 2006 | Mogensen M, Bagger M, Pedersen PK, Fernström M, Sahlin K (2006) Cycling efficiency in humans is related to low UCP3 content and to type I fibres but not to mitochondrial efficiency. J Physiol 571:669-81. | Human | Skeletal muscle | ||
| Ponsot 2006 J Appl Physiol (1985) | 2006 | Ponsot E, Dufour SP, Zoll J, Doutrelau S, N'Guessan B, Geny B, Hoppeler H, Lampert E, Mettauer B, Ventura-Clapier R, Richard R (2006) Exercise training in normobaric hypoxia in endurance runners. II. Improvement of mitochondrial properties in skeletal muscle. J Appl Physiol (1985) 100:1249-57. | Human | Skeletal muscle | Hypoxia | |
| Garnier 2005 FASEB J | 2005 | Garnier A, Fortin D, Zoll J, N'Guessan B, Mettauer B, Lampert E, Veksler V, Ventura-Clapier R (2005) Coordinated changes in mitochondrial function and biogenesis in healthy and diseased human skeletal muscle. FASEB J 19:43-52. | Human | Skeletal muscle | ||
| N'Guessan 2004 Mol Cell Biochem | 2004 | N'Guessan B, Zoll J, Ribera F, Ponsot E, Lampert E, Ventura-Clapier R, Veksler V, Mettauer B (2004) Evaluation of quantitative and qualitative aspects of mitochondrial function in human skeletal and cardiac muscles. Mol Cell Biochem 256-257:267-80. | Human | Skeletal muscle | ||
| Rasmussen 2003 Eur J Physiol | 2003 | Rasmussen UF, Krustrup P, Kjaer M, Rasmussen HN (2003) Human skeletal muscle mitochondrial metabolism in youth and senescence: no signs of functional changes in ATP formation and mitochondrial oxidative capacity. Pflugers Arch – Eur J Physiol 446:270-78. | Human | Skeletal muscle | Aging;senescence | |
| Zoll 2002 J Physiol | 2002 | Zoll J, Sanchez H, N'Guessan B, Ribera F, Lampert E, Bigard X, Surrurier B, Fortin D, Geny B, Veksler V, Ventura-Clapier R, Mettauer B (2002) Physical activity changes the regulation of mitochondrial respiration in human skeletal muscle. J Physiol 543:191-200. | Human | Skeletal muscle | ||
| Mettauer 2001 J Am Coll Cardiol | 2001 | Mettauer B, Zoll J, Sanchez H, Lampert E, Ribera F, Veksler V, Bigard X, Mateo P, Epailly E, Lonsdorfer J, Ventura-Clapier R (2001) Oxidative capacity of skeletal muscle in heart failure patients versus sedentary or active control subjects. J Am Coll Cardiol 38:947-54. | Human | Skeletal muscle | Cardiovascular | |
| Deurenberg 2001 Eur J Clin Nutr | 2001 | Deurenberg P, Andreoli A, Borg P, Kukkonen-Harjula K, de Lorenzo A, van Marken Lichtenbelt WD, Testolin G, Vigano R, Vollaard N (2001) The validity of predicted body fat percentage from body mass index and from impedance in samples of five European populations. Eur J Clin Nutr 55:973-9. | Human | Fat | Obesity | |
| Rasmussen 2001 Am J Physiol Endocrinol Metab | 2001 | Rasmussen UF, Rasmussen HN, Krustrup P, Quistorff B, Saltin B, Bangsbo J (2001) Aerobic metabolism of human quadriceps muscle: in vivo data parallel measurements on isolated mitochondria. Am J Physiol Endocrinol Metab 280:E301-7. | Human | Skeletal muscle | ||
| Gallagher 2000 Am J Clin Nutr | 2000 | Gallagher D, Heymsfield SB, Heo M, Jebb SA, Murgatroyd PR, Sakamoto Y (2000) Healthy percentage body fat ranges: an approach for developing guidelines based on body mass index. Am J Clin Nutr 72:694-701. | Human | Fat | Obesity | |
| Cole 2000 BMJ | 2000 | Cole TJ, Bellizzi MC, Flegal KM, Dietz WH (2000) Establishing a standard definition for child overweight and obesity worldwide: international survey. BMJ 320:1240-3. | Human | Obesity | ||
| Zucker 1962 Committee on Biological Handbooks, Fed Amer Soc Exp Biol | 1962 | Zucker TF (1962) Regression of standing and sitting weights on body weight: man. In: Growth including reproduction and morphological development. Altman PL, Dittmer DS, eds: Committee on Biological Handbooks, Fed Amer Soc Exp Biol:336-7. | Human |