De Onis 2007 Bull World Health Organization
| de Onis M, Onyango AW, Borghi E, Siyam A, Nishida C, Siekmann J (2007) Development of a WHO growth reference for school-aged children and adolescents. Bull World Health Organization 85:660-7. |
de Onis M, Onyango AW, Borghi E, Siyam A, Nishida C, Siekmann J (2007) Bull World Health Organization
Abstract: OBJECTIVE: To construct growth curves for school-aged children and adolescents that accord with the WHO Child Growth Standards for preschool children and the body mass index (BMI) cut-offs for adults.
METHODS: Data from the 1977 National Center for Health Statistics (NCHS)/WHO growth reference (1-24 years) were merged with data from the under-fives growth standards' cross-sectional sample (18-71 months) to smooth the transition between the two samples. State-of-the-art statistical methods used to construct the WHO Child Growth Standards (0-5 years), i.e. the Box-Cox power exponential (BCPE) method with appropriate diagnostic tools for the selection of best models, were applied to this combined sample.
FINDINGS: The merged data sets resulted in a smooth transition at 5 years for height-for-age, weight-for-age and BMI-for-age. For BMI-for-age across all centiles the magnitude of the difference between the two curves at age 5 years is mostly 0.0 kg/m(2) to 0.1 kg/m(2). At 19 years, the new BMI values at +1 standard deviation (SD) are 25.4 kg/m(2) for boys and 25.0 kg/m(2) for girls. These values are equivalent to the overweight cut-off for adults (> or = 25.0 kg/m(2)). Similarly, the +2 SD value (29.7 kg/m(2) for both sexes) compares closely with the cut-off for obesity (> or = 30.0 kg/m(2)).
CONCLUSION: The new curves are closely aligned with the WHO Child Growth Standards at 5 years, and the recommended adult cut-offs for overweight and obesity at 19 years. They fill the gap in growth curves and provide an appropriate reference for the 5 to 19 years age group.
• Bioblast editor: Gnaiger E
From BMI to BME
Work in progress by Gnaiger E 2020-01-20 linked to a preprint in preparation on BME and mitObesity.

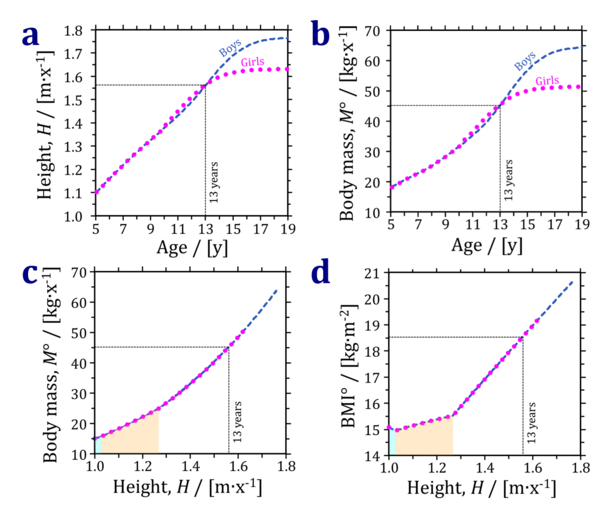
- The WHO growth reference for school-aged children and adolescents [1-3] provides the data set upon which the allometric dependence of body mass on height is defined for the healthy reference population. While straight mathematical fitting procedures can be applied to obtain the global best fit, a best fit by a conceptually defined algorithm is obtained only by breaking the continuous function into distinct phases. Application of the allometric power law reveals four phases of growth.
- Figure 1 is based on the WHO Child Growth Standards [1-3]. It illustrates the limitation of the BMI as an index of overweight and obesity. The precision body mass index, BMI°, is claculated for the healthy reference population (HRP), in which neither underweight nor overweight prevails and which, therefore, should be characterized by a constant index. This is achieved by the body mass excess, BME [4], which relates the actual body mass, M, to the reference body mass, M°, at a given height, BME=(M-M°/M°). The BME is constant at 0.0 for the HRP for both sexes independent of height. In contrast, the increase of the precision BMI° from 15 to 21 kg·m-2 from 1.0 to 1.8 m represents a confounding factor which explains the necessity of adjusting the BMI cutoff points. Instead of a focus on adjusted BMI cutoff points [3], research should focus on evaluation of the concept of BME and the HRP.
Publications: BME and height
| Reference | |
|---|---|
| Bosy-Westphal 2009 Br J Nutr | Bosy-Westphal A, Plachta-Danielzik S, Dörhöfer RP, Müller MJ (2009) Short stature and obesity: positive association in adults but inverse association in children and adolescents. Br J Nutr 102:453-61. |
| De Onis 2007 Bull World Health Organization | de Onis M, Onyango AW, Borghi E, Siyam A, Nishida C, Siekmann J (2007) Development of a WHO growth reference for school-aged children and adolescents. Bull World Health Organization 85:660-7. |
| Gnaiger 2019 MiP2019 | OXPHOS capacity in human muscle tissue and body mass excess – the MitoEAGLE mission towards an integrative database (Version 6; 2020-01-12). |
| Hood 2019 Nutr Diabetes | Hood K, Ashcraft J, Watts K, Hong S, Choi W, Heymsfield SB, Gautam RK, Thomas D (2019) Allometric scaling of weight to height and resulting body mass index thresholds in two Asian populations. Nutr Diabetes 9:2. doi: 10.1038/s41387-018-0068-3. |
| Indian Academy of Pediatrics Growth Charts Committee 2015 Indian Pediatr | Indian Academy of Pediatrics Growth Charts Committee, Khadilkar V, Yadav S, Agrawal KK, Tamboli S, Banerjee M, Cherian A, Goyal JP, Khadilkar A, Kumaravel V, Mohan V, Narayanappa D, Ray I, Yewale V (2015) Revised IAP growth charts for height, weight and body mass index for 5- to 18-year-old Indian children. Indian Pediatr 52:47-55. |
| Zucker 1962 Committee on Biological Handbooks, Fed Amer Soc Exp Biol | Zucker TF (1962) Regression of standing and sitting weights on body weight: man. In: Growth including reproduction and morphological development. Altman PL, Dittmer DS, eds: Committee on Biological Handbooks, Fed Amer Soc Exp Biol:336-7. |
Labels: MiParea: Gender, Developmental biology
Pathology: Obesity
Organism: Human
Preparation: Intact organism
BMI, BME, Height

